Skip to McMaster Navigation Skip to Site Navigation Skip to main content
McMaster logo

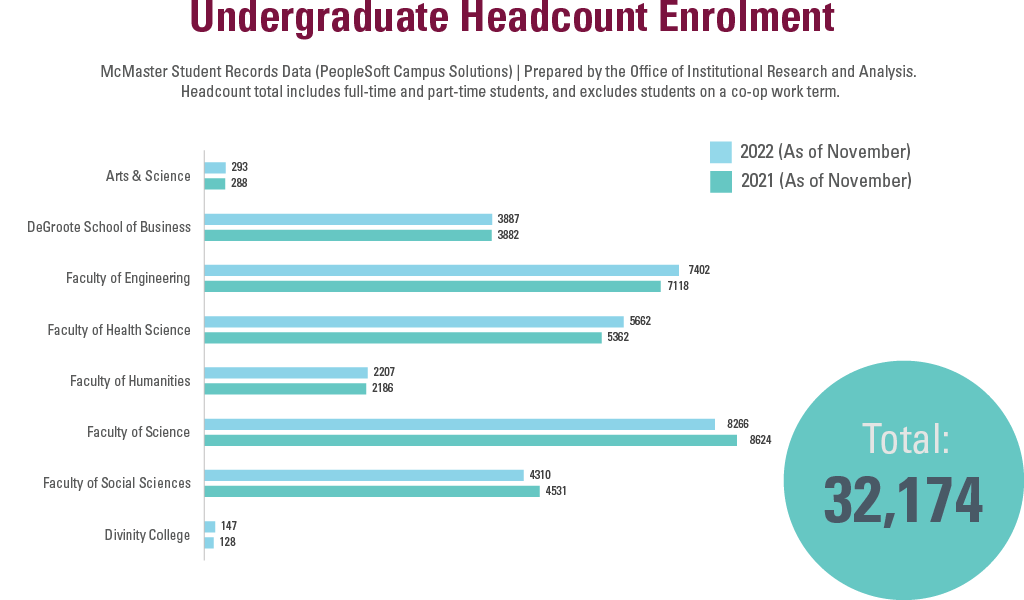
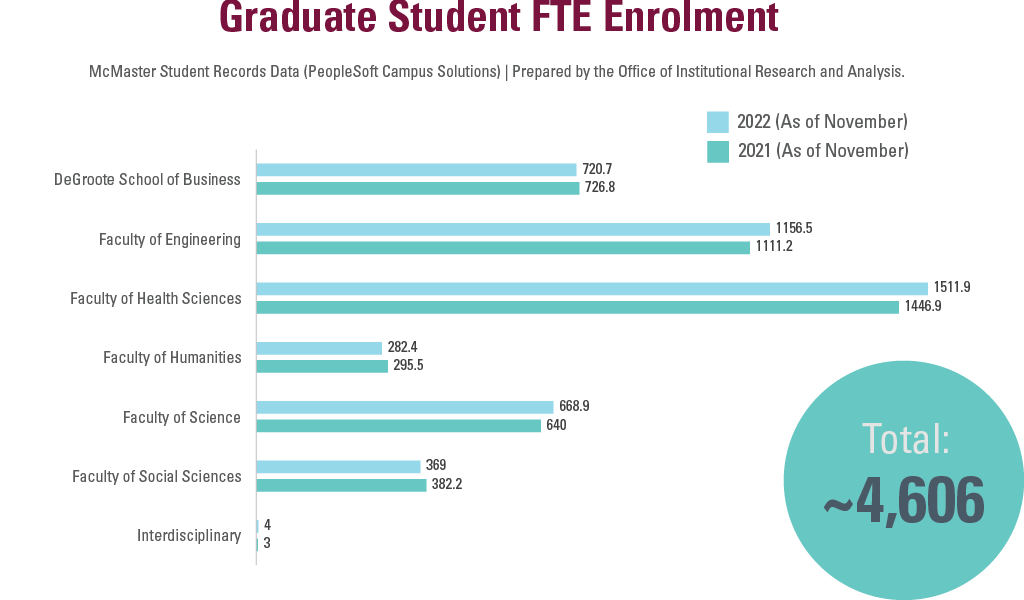
By the Numbers: Faculty Breakdown

Demonstrating Impact Across Campus: By the Numbers

The following engagement metrics demonstrate our impact measured across McMaster’s academic Faculties and Programs. While these numbers do not represent all of our touchpoints with students throughout the year, they present a high-level overview of our strategic efforts to provide a holistic, personalized suite of services and supports for McMaster’s student communities. 

Information Box Group

Event registrants: 46K+

One-on-one student appointments: 8,711

Opportunities posted on OSCARplus (paid and experiential): 6,894

Information Box Group

Bar graph reflecting the number of Access Program Awards, totalling 132 awards in the 2022 to 2023 cycle. Award numbers include the following in the graph. In 2020 to 2021, 40 students. In 2021 to 2022, 45 students. In 2022 to 2023, 143 students. In 2023 to 2024, 108 students. Awards administered also include Youth in Extended Society Care Tuition Bursary.

Bar graph reflecting student event attendance by Faculty for the Access Program, totalling 1528 in the 2022 to 2023 cycle. Breakdown shows the following in the graph. Science Undergrad (80), Health Sciences Undergrad (42), Engineering Undergrad (31), Social Sciences Undergrad (19), Humanities Undergrad (18), DeGroote School of Business Undergrad (11), Engineering Grad (5), Interdisciplinary Studies Undergrad (5), Arts and Science Undergrad (2), Interdisciplinary Studies Grad (1), and Outreach for Grades 12 and lower students (1314).

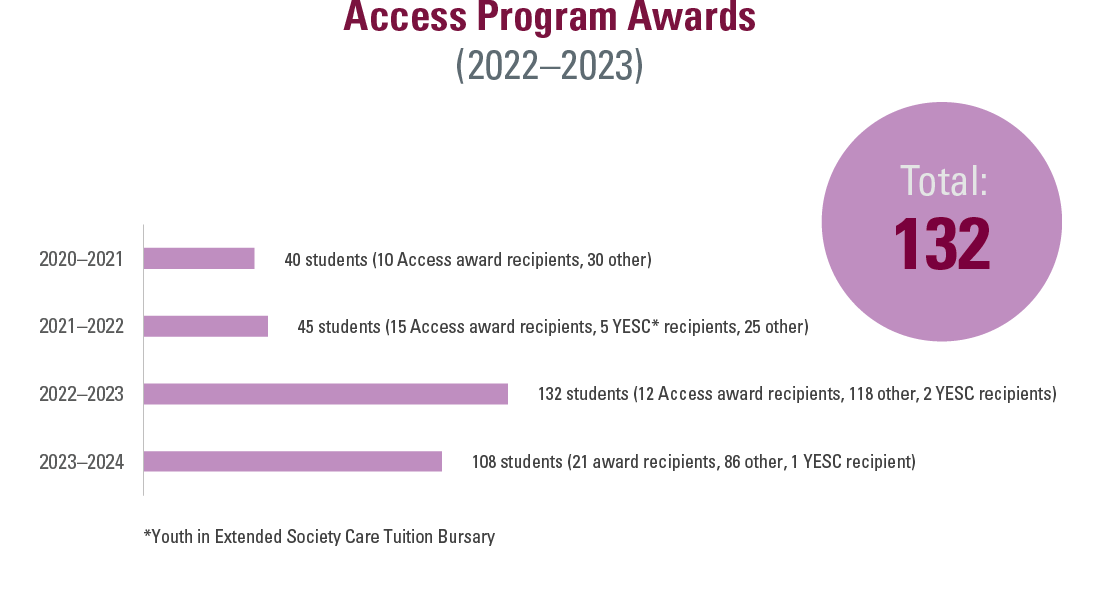
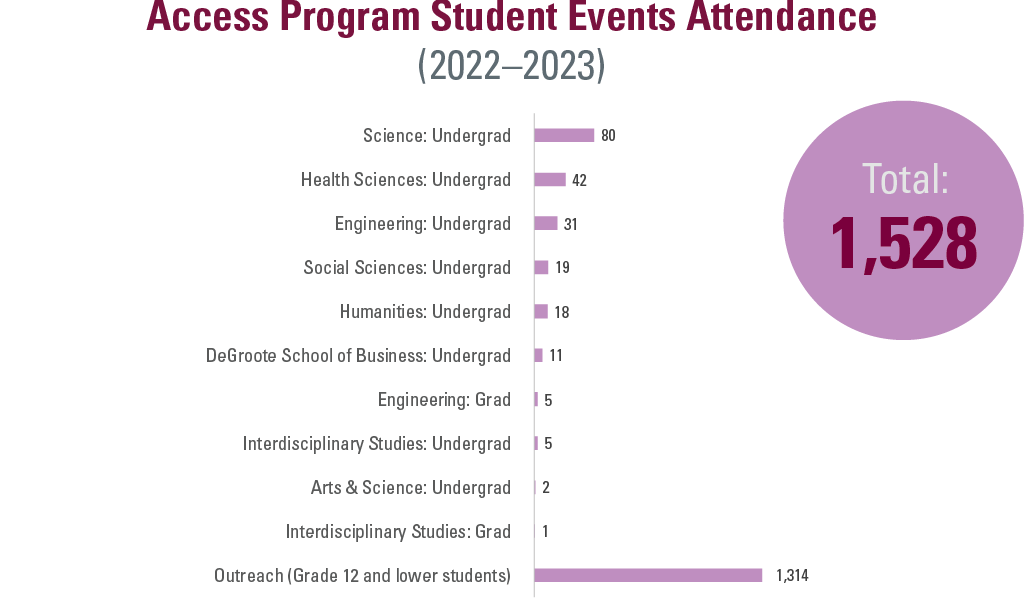
  • In addition to the numbers reflected, the Access Program strategically integrates into offerings across Student Affairs and recruitment events such as May@Mac.

Information Box Group

Bar graph reflecting student appointments by Faculty for First-Year Transition and Experience, totalling 1447 in the 2022 to 2023 cycle. Breakdown shows the following in the graph. Arts and Science Undergrad (6), DeGroote School of Business Undergrad (233), Engineering Undergrad (334), Health Sciences Undergrad (145), Humanities Undergrad (151), Science Undergrad (347), and Social Sciences Undergrad (231).

Bar graph reflecting student event attendance by Faculty for First-Year Transition and Experience, totalling 33265 in the 2022 to 2023 cycle. Breakdown shows the following in the graph. Science Undergrad (11231), Engineering Undergrad (7124), Health Sciences Undergrad (4545), DeGroote School of Business Undergrad (3620), Social Sciences Undergrad (3435), Humanities Undergrad (1572), Interdisciplinary Studies Undergrad (972), Arts and Science Undergrad (691), Exchange and Visiting Students (24), Engineering Grad (20), Science Grad (13), Health Sciences Grad (7), Social Sciences Grad (6), Interdisciplinary Studies Grad (4), DeGroote School of Business Grad (1).

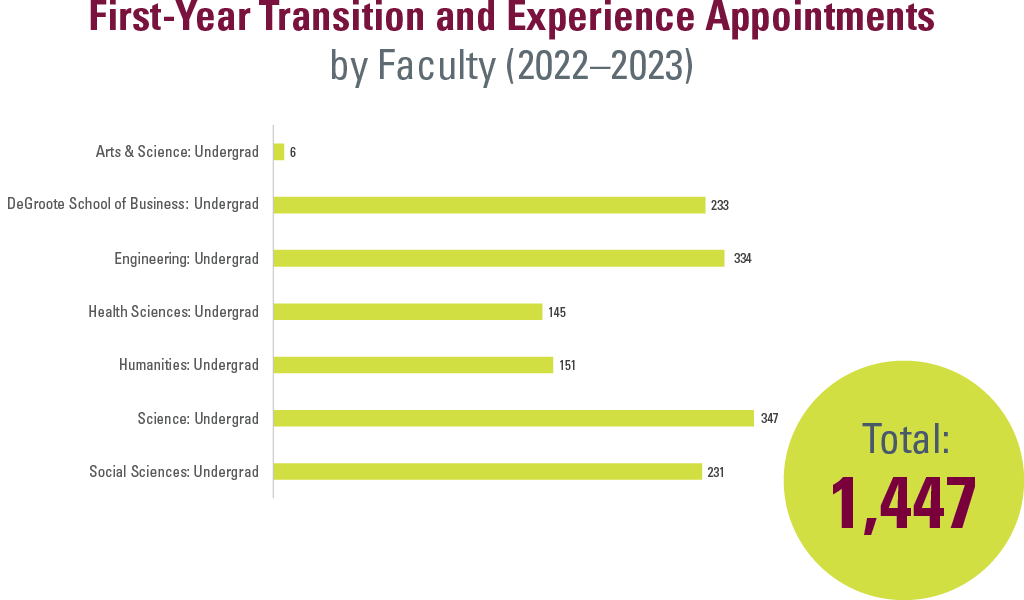
  • Appointment numbers this year reflect off-campus students only and do not include one-on-one numbers from students living in residence.
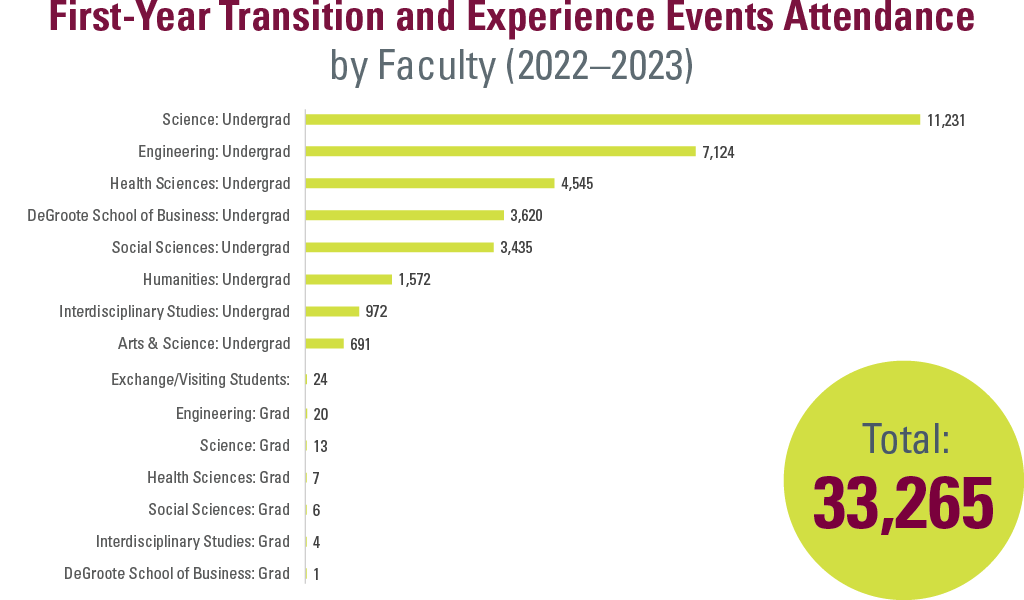
  • The increase in attendance from 11,987 attendees in 2021–2022 to 30,000+ attendance in 2022–2023 demonstrates the impact of McMaster’s return to campus and overall collaboration and partnership through the Orientation Committee model.
  • With the integration of the First-Year Transition and Experience portfolio into the Student Success Centre, this year’s numbers include first-year academic skills programs such as Mac101, Welcome Week workshops and Archway events. Grad student participation in the attendance reflects initiatives focused on first-year students but open to all students.

Information Box Group

Year-by-year bar graph reflecting student appointments by Faculty for Writing and Academic Skills, totalling 1159 in the 2022 to 2023 cycle. Breakdown shows the following in the graph, with the first number showing 2021 to 2022 and the second number showing 2022 to 2023. Arts and Science Undergrad (21, 27). DeGroote School of Business, Undergrad (36,93) and Grad (2,18). Engineering Undergrad (72,97) and Grad (13,17). Health Sciences Undergrad (50,115) and Grad (56,104). Humanities Undergrad (56,104) and Grad (5, 16). Science Undergrad (250, 246) and Grad (7,21). Social Sciences Undergrad (152,242) and Grad (10,27). Interdisciplinary Studies Undergrad (13,9) and Grad (20, 48). Divinity College (2, 0). Exchange and Visiting Students (0,2).

Year-by-year bar graph reflecting student events attendance by Faculty for Writing and Academic Skills, totalling 3481 in the 2022 to 2023 cycle. Breakdown shows the following in the graph, with the first number showing 2021 to 2022 and the second number showing 2022 to 2023. Arts and Science Undergrad (72,22). DeGroote School of Business, Undergrad (411,149) and Grad (21,10). Engineering Undergrad (941,332) and Grad (239,15). Health Sciences Undergrad (414,274) and Grad (103,22). Humanities Undergrad (385,134) and Grad (64,18). Science Undergrad (2067,751) and Grad (63,11). Social Sciences Undergrad (655,198) and Grad (91,23). Interdisciplinary Studies Undergrad (18,13) and Grad (94,17). Exchange and Visiting Students (56,2). Custom Workshops (1490 in 2022 to 2023).

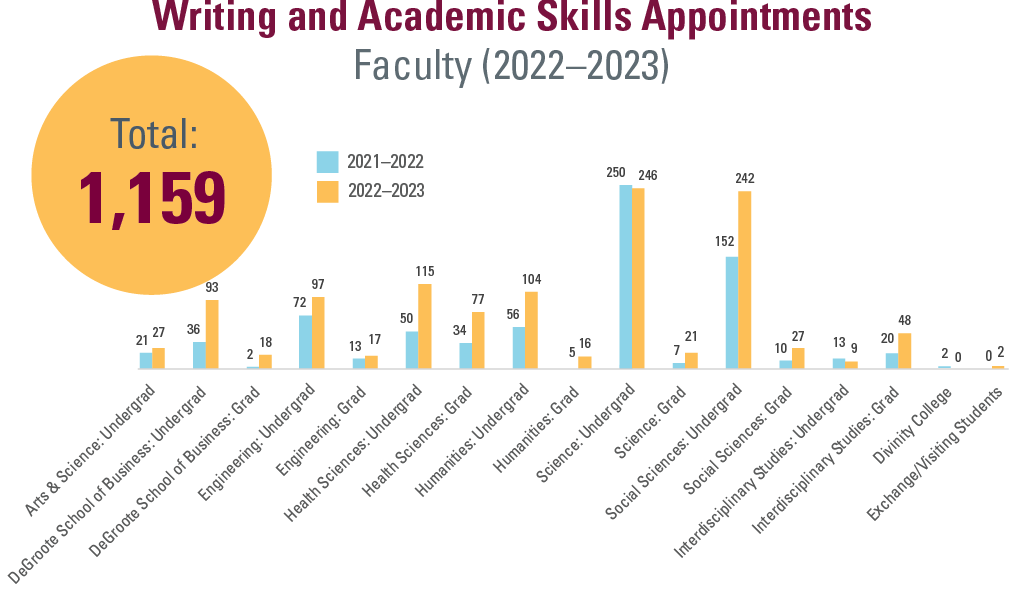
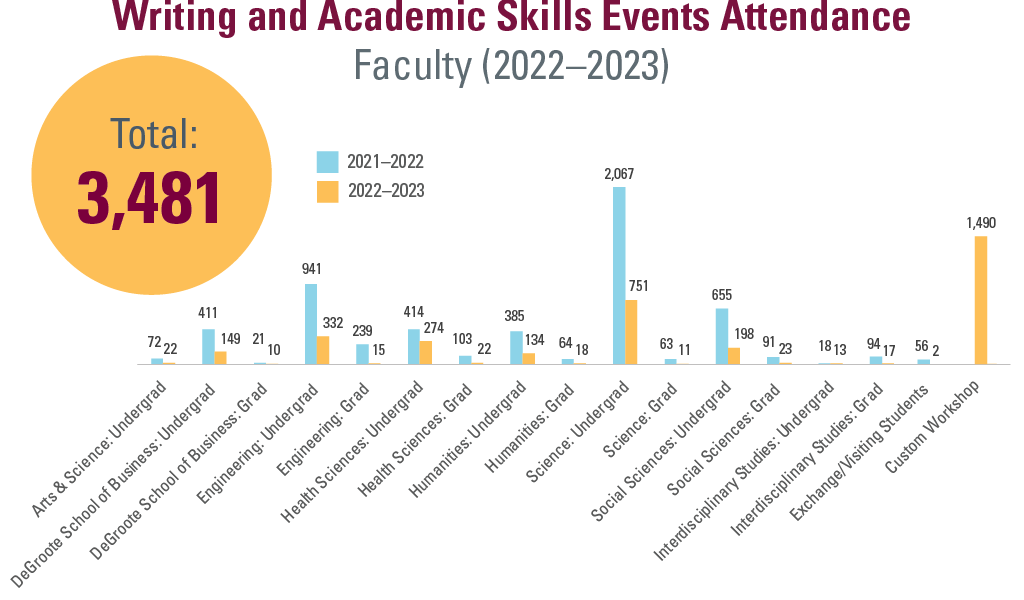
  • The Writing and Academic Skills portfolio has strategically focused on personalization, prioritizing one-on-one appointments and delivery of custom workshops. With the integration of First-Year Transition and Experience into the Student Success Centre, offerings such as Mac101, Welcome Week workshops and Archway events are also now reflected in a different portfolio.
  • Increase in graduate student numbers is reflective of the Strategic Alignment Fund project in partnership with the School of Graduate Studies, Faculty and Program partners and the Graduate Students Association (GSA).
  • Custom workshops delivered to 1,490 students in the following courses and/or area: MATLS4LB2, SOCSCI1T03, COMM1EO3, Indigenous Student Services, MSc Physiotherapy Program, Child Life & Pediatric Psychosocial Care Program, School of Nursing, LABRST 1A03E, Honours B.S.W. Program, MSc Physiotherapy Program, PT Prac, and ART 4EP3. 

Information Box Group

Year-by-year bar graph reflecting student appointments by Faculty for International and Exchange Student Experience, totalling 2287 in the 2022 to 2023 cycle. Breakdown shows the following in the graph, with the first number showing 2021 to 2022 and the second number showing 2022 to 2023. Arts and Science Undergrad (1,2). DeGroote School of Business, Undergrad (337,300) and Grad (43,183). Engineering Undergrad (447,468) and Grad (161,384). Health Sciences Undergrad (18,20) and Grad (27,33). Humanities Undergrad (81,103) and Grad (8,21). Science Undergrad (402,379) and Grad (18,55). Social Sciences Undergrad (272,248) and Grad (11,27). Interdisciplinary Studies Undergrad (14,14) and Grad (23,36). Exchange and Visiting Students (7,14).

Year-by-year bar graph reflecting student events attendance by Faculty for International and Exchange Student Experience, totalling 4706 in the 2022 to 2023 cycle. Breakdown shows the following in the graph, with the first number showing 2021 to 2022 and the second number showing 2022 to 2023. Arts and Science Undergrad (9,3). DeGroote School of Business, Undergrad (222,579) and Grad (91,188). Engineering Undergrad (568,862) and Grad (675,990). Health Sciences Undergrad (70,91) and Grad (34,82). Humanities Undergrad (118,208) and Grad (9,15). Science Undergrad (631,825) and Grad (76,112). Social Sciences Undergrad (351,361) and Grad (21,68). Interdisciplinary Studies Undergrad (13,17) and Grad (54,147). Graduate Studies (56,0). Exchange and Visiting Students (0,158).

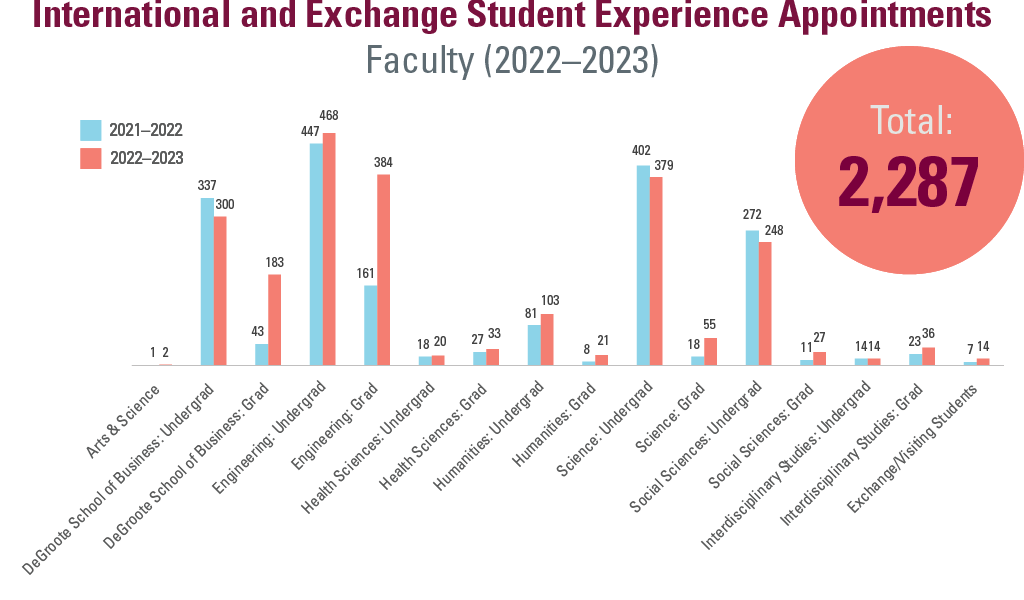
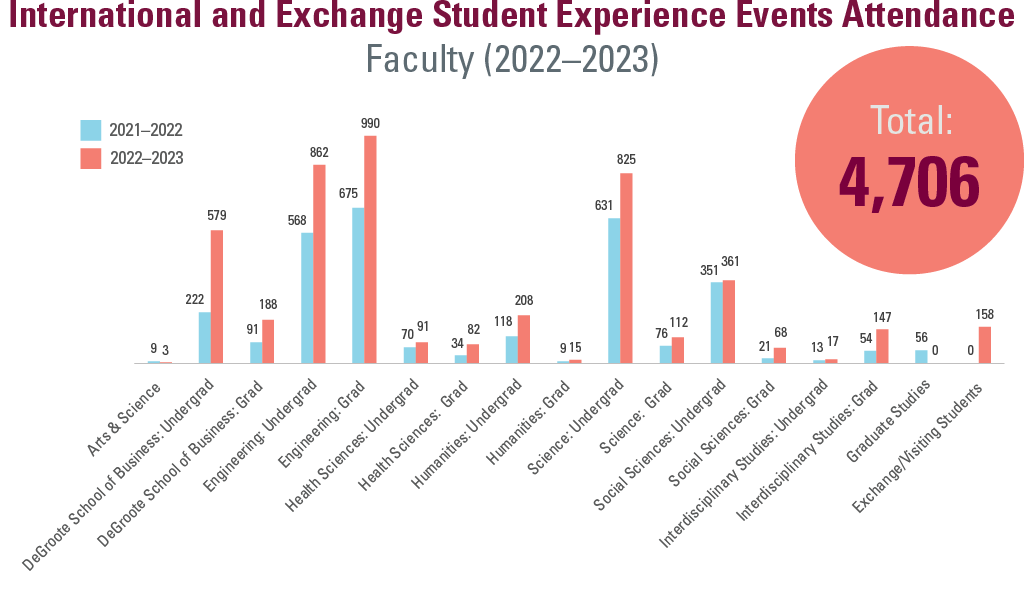
  • There were significant increases in engagement with international and incoming exchange students, with a 22% increase in overall appointments and a 57% increase in event attendance.
  • Immigration advising continues to be a core offering, supporting students with study permits, post-graduate work permits (PGWP), visas and other issues related to status in Canada. 
  • The highest engagement events included the Soccer Headquarters in the newly launched International and Exchange Student Experience Lounge and the end-of-the-year Multicultural Showcase.

Information Box Group

Year-by-year bar graph reflecting student appointments by Faculty for Career Counselling and Employment, totalling 3379 in the 2022 to 2023 cycle. Breakdown shows the following in the graph, with the first number showing 2021 to 2022 and the second number showing 2022 to 2023. Arts and Science Undergrad (38,56). DeGroote School of Business, Undergrad (215,367) and Grad (9,42). Engineering Undergrad (558,410) and Grad (83,124). Health Sciences Undergrad (173,219) and Grad (69,112). Humanities Undergrad (191,249) and Grad (40,54). Science Undergrad (1105,1067) and Grad (30,69). Social Sciences Undergrad (564,403) and Grad (35,49). Interdisciplinary Studies Undergrad (0,51) and Grad (81,103). Divinity College (0,2). Graduate Studies (1,0). Continuing Education Grad (7,3).

Year-by-year bar graph reflecting student events attendance by Faculty for Career Counselling and Employment, totalling 5683 in the 2022 to 2023 cycle. Breakdown shows the following in the graph, with the first number showing 2021 to 2022 and the second number showing 2022 to 2023. Arts and Science Undergrad (38,51). DeGroote School of Business, Undergrad (215,525) and Grad (9,164). Engineering Undergrad (558,1640) and Grad (83,412). Health Sciences Undergrad (173,441) and Grad (69,61). Humanities Undergrad (191,193) and Grad (40,13). Science Undergrad (1105,1402) and Grad (30,52). Social Sciences Undergrad (564,488) and Grad (35,39). Interdisciplinary Studies Undergrad (0,103) and Grad (81,66). Divinity College (0,26). Graduate Studies (1,0). Continuing Education Grad (7,0). Exchange and Visiting Students (0,7).

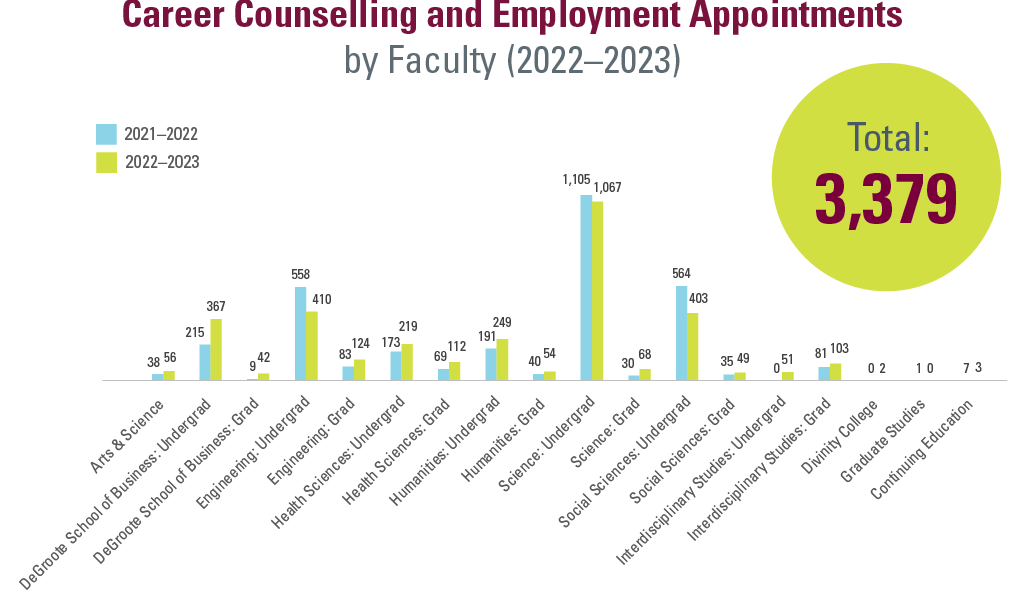
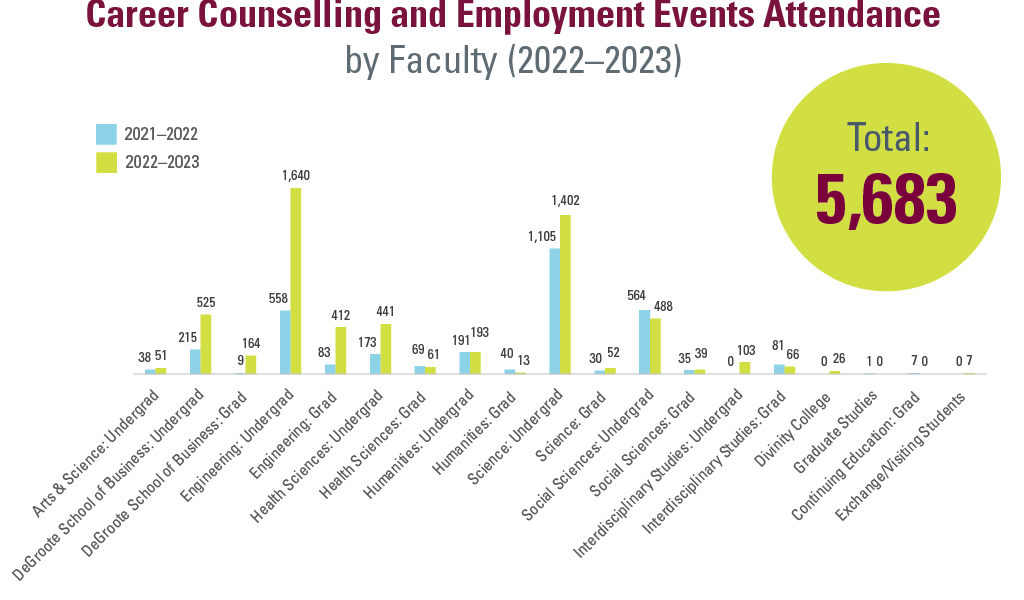
  • Career counselling and advising appointments increased by 5% and event attendance by 14% overall. 
  • Graduate student engagement and usage also increased across almost all Faculties due to a Strategic Alignment Fund project through the Office of the Provost, delivered in partnership with the School of Graduate Studies, Faculty stakeholders and the Graduate Students Association. 
  • Taking a holistic approach to increasing access to employment for undergraduate students, graduate students and alumni, Career Access Professional Services (CAPS) facilitated 145 CAPS and 124 International Student Work Opportunity (ISWO) placements. 
  • Additionally, in 2022, 1,128 alumni career appointments were delivered in partnership with Alumni Association. Of these appointments, 78% were undergraduate and 22% were graduate alumni. 

Information Box Group

Bar graph reflecting student appointments by Faculty for Experiential Learning and Global Experience, totalling 65 in the 2022 to 2023 cycle. Breakdown shows the following in the graph. DeGroote School of Business Undergrad (8), Engineering Undergrad (9), Health Sciences Undergrad (7), Humanities Undergrad (2), Science Undergrad (24), Science Grad (1), Social Sciences Undergrad (6), Interdisciplinary Studies Undergrad (6), Interdisciplinary Studies Grad (2).

Bar graph reflecting student events attendance by Faculty for Experiential Learning and Global Experience, totalling 2710 in the 2022 to 2023 cycle. Breakdown shows the following in the graph. Arts and Science Undergrad (29), DeGroote School of Business Undergrad (222), DeGroote School of Business Grad (31), Engineering Undergrad (646), Engineering Grad (77), Health Sciences Undergrad (268), Health Sciences Grad (19), Humanities Undergrad (124), Humanities Grad (2), Science Undergrad (809), Science Grad (12), Social Sciences Undergrad (353), Social Sciences Grad (17), Interdisciplinary Studies Undergrad (70), Interdisciplinary Studies Grad (28), Exchange and Visiting Students (3).

Bar graph reflecting student applications by Faculty for Experiential Learning and Global Experience, totalling 2028 in the 2022 to 2023 cycle. Breakdown shows the following in the graph. Arts and Science Undergrad (22), DeGroote School of Business Undergrad (148), DeGroote School of Business Grad (22), Engineering Undergrad (684), Engineering Grad (44), Health Sciences Undergrad (162), Health Sciences Grad (34), Humanities Undergrad (74), Science Undergrad (503), Science Grad (12), Social Sciences Undergrad (232), Social Sciences Grad (10), Interdisciplinary Studies Undergrad (68), Interdisciplinary Studies Grad (13).

Bar graph reflecting student placements by Faculty for Experiential Learning and Global Experience, totalling 1019 in the 2022 to 2023 cycle. Breakdown shows the following in the graph. Arts and Science Undergrad (4), DeGroote School of Business Undergrad (97), DeGroote School of Business Grad (11), Engineering Undergrad (250), Engineering Grad (15), Health Sciences Undergrad (92), Health Sciences Grad (9), Humanities Undergrad (38), Science Undergrad (227), Science Grad (3), Social Sciences Undergrad (107), Social Sciences Grad (6), Interdisciplinary Studies Undergrad (37), Interdisciplinary Studies Grad (8), Exchange and Visiting Students (1), Global Experience Award (114).

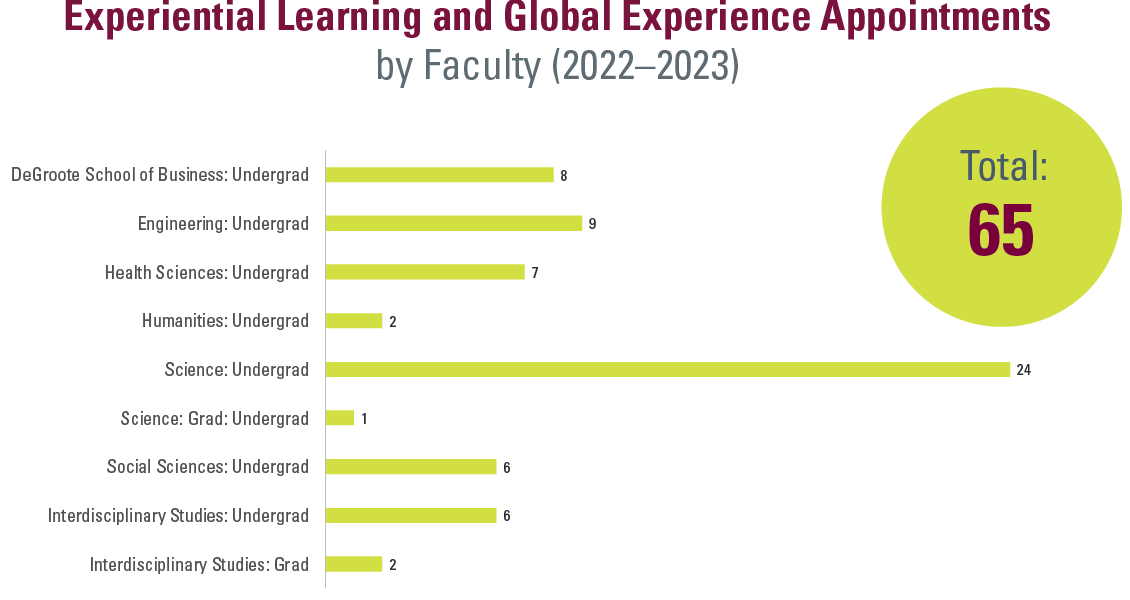
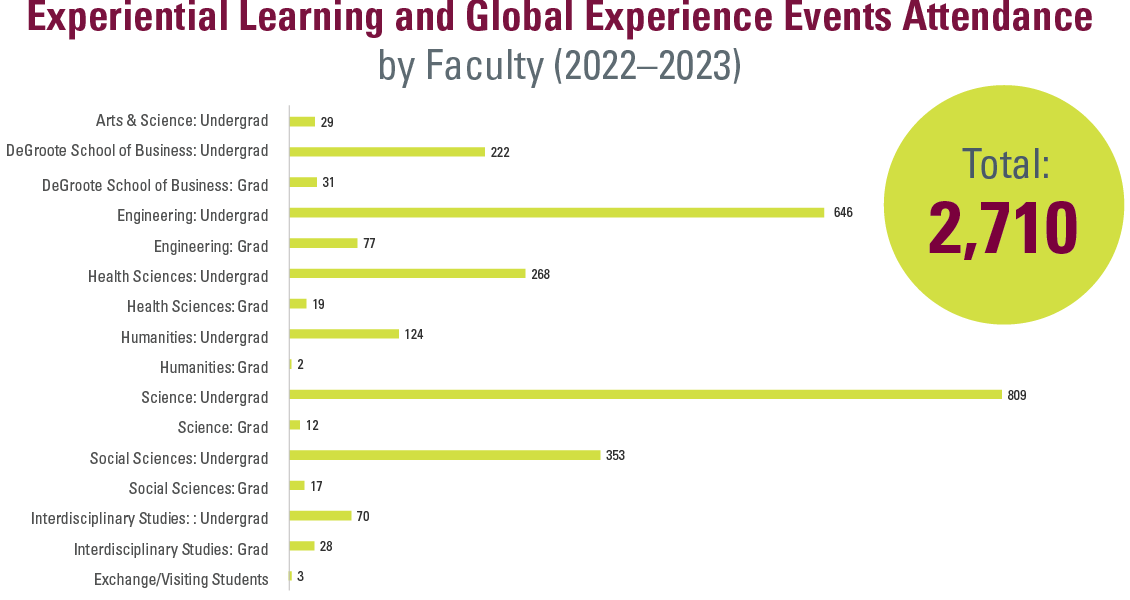
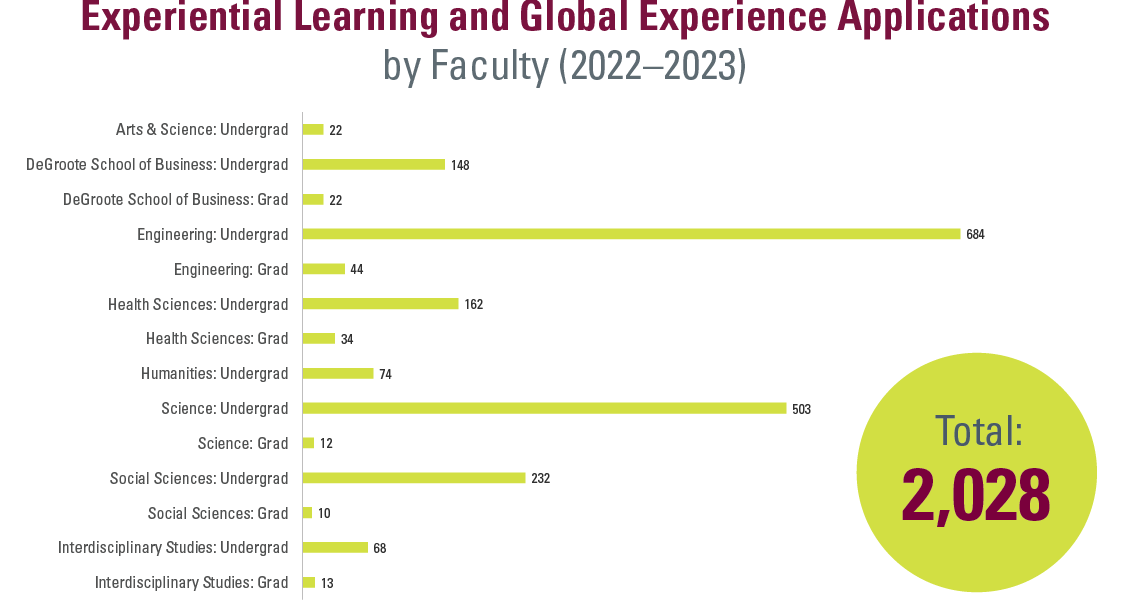
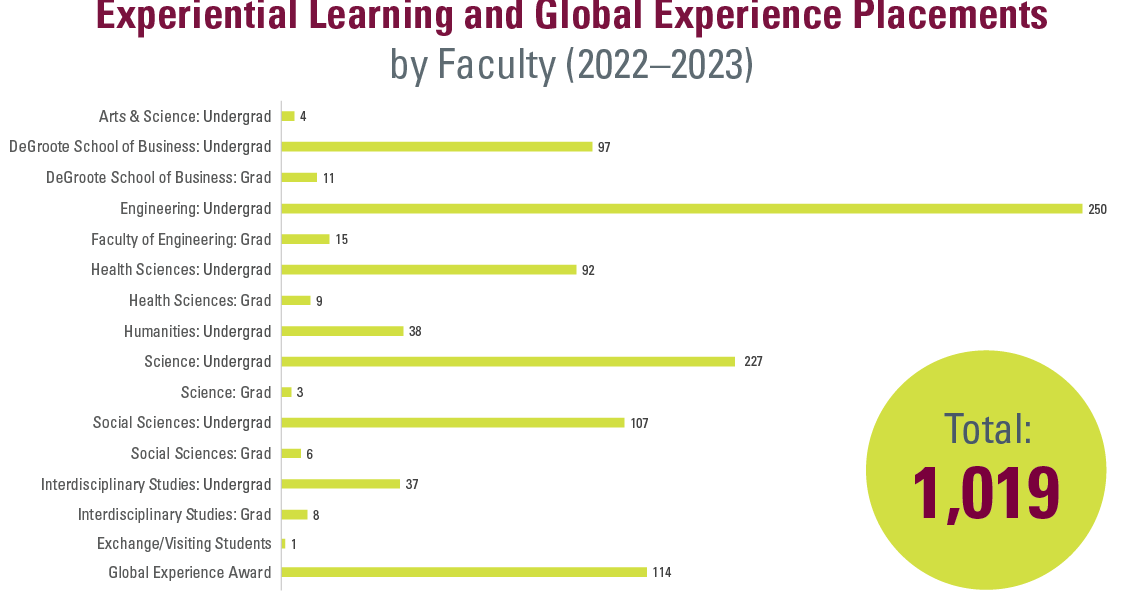
  • This year’s numbers represent 1,000+ co-curricular experiential placements overall, including embedded supports throughout programming and delivery, such as with MCYU, Political Science 4AL3 and CityLab.
  • Experiential and global learning are combined to support fostering global citizenship locally, nationally and globally, with 114 students awarded the Global Experience Award.
  • In partnership with the community, there was high engagement at the Online Community Engagement and Volunteer Fair and 700 applications to volunteer positions.

Information Box Group

Year-by-year bar graph reflecting student appointments by Faculty for Financial Literacy, totalling 302 in the 2022 to 2023 cycle. Breakdown shows the following in the graph, with the first number showing 2021 to 2022 and the second number showing 2022 to 2023. Arts and Science Undergrad (1,2). DeGroote School of Business, Undergrad (5,9) and Grad (8,8). Engineering Undergrad (21,60) and Grad (19,38). Health Sciences Undergrad (3,10) and Grad (5,3). Humanities Undergrad (4,12) and Grad (3,1). Science Undergrad (24,50) and Grad (3,7). Social Sciences Undergrad (6,49) and Grad (2,2). Interdisciplinary Studies Undergrad (4,17) and Grad (5,5).

Year-by-year bar graph reflecting student events attendance by Faculty for Financial Literacy, totalling 893 in the 2022 to 2023 cycle. Breakdown shows the following in the graph, with the first number showing 2021 to 2022 and the second number showing 2022 to 2023. Arts and Science Undergrad (1,0). DeGroote School of Business, Undergrad (41,119) and Grad (20,34). Engineering Undergrad (118,176) and Grad (20,47). Health Sciences Undergrad (20,47) and Grad (20,24). Humanities Undergrad (19,28) and Grad (2,6). Science Undergrad (105,141) and Grad (28,30). Social Sciences Undergrad (58,101) and Grad (10,9). Interdisciplinary Studies Undergrad (7,13) and Grad (17,25). Exchange and Visiting Students (0,10).

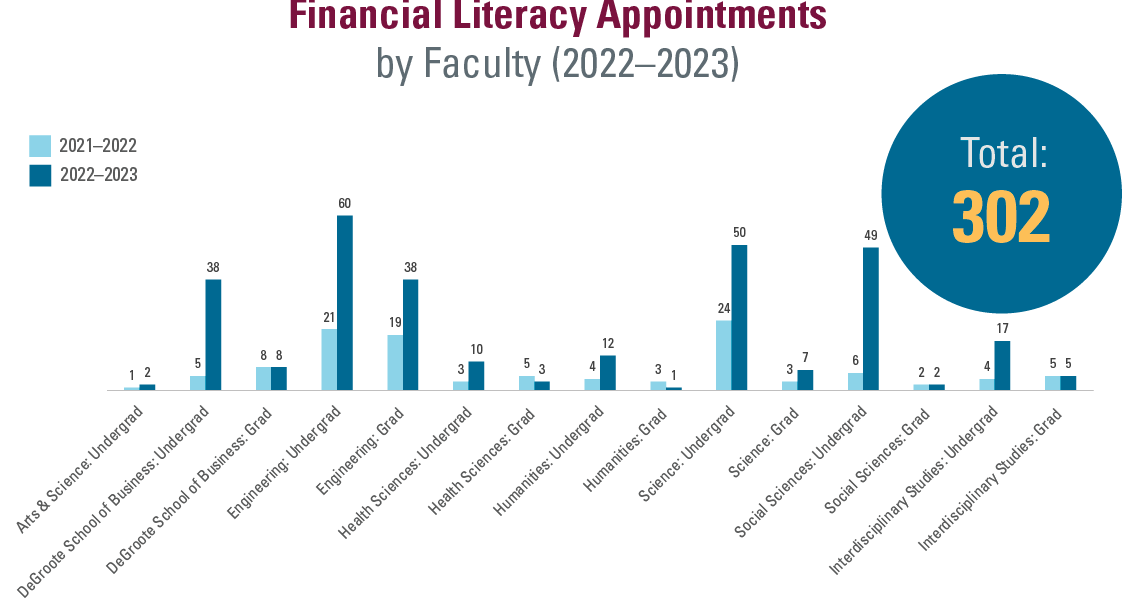
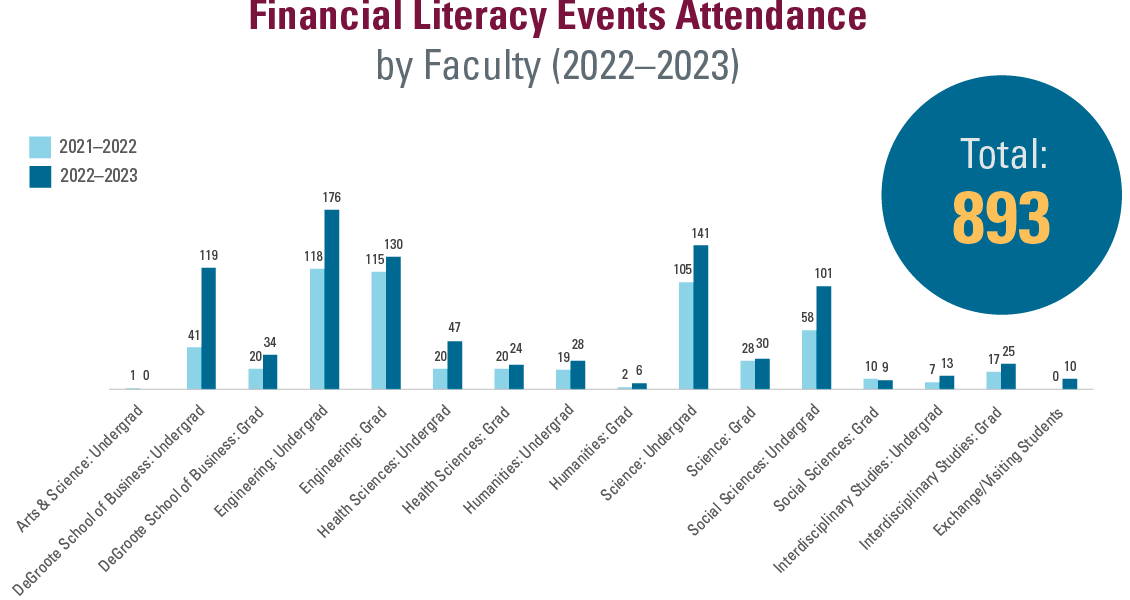
  • Financial wellness continues to be a top stressor facing students, impacting their success in school and life.
  • This year’s numbers document significant increases in both appointment and event engagement, especially high for initiatives through Financial Literacy Month and Tax Season with the Tax Squad volunteer team.
  • This year’s tax support resulted in 1,260 tax returns filed and $3.6 million in benefits and credits for the community.

Information Box Group

Year-by-year bar graph reflecting graduate FTE enrolment by Faculty, totalling approximately 4606 in Fall 2022. Breakdown shows the following in the graph, with the first number showing November 2021 and the second number showing November 2022. DeGroote School of Business (726.8, 720.7). Engineering (1111.2, 1156.5). Health Sciences (1446.9, 1511.9). Humanities (295.5, 282.4). Science (640,668.9). Social Sciences (382.2,369). Interdisciplinary Studies (3,4).