Quick Facts 2020-2021
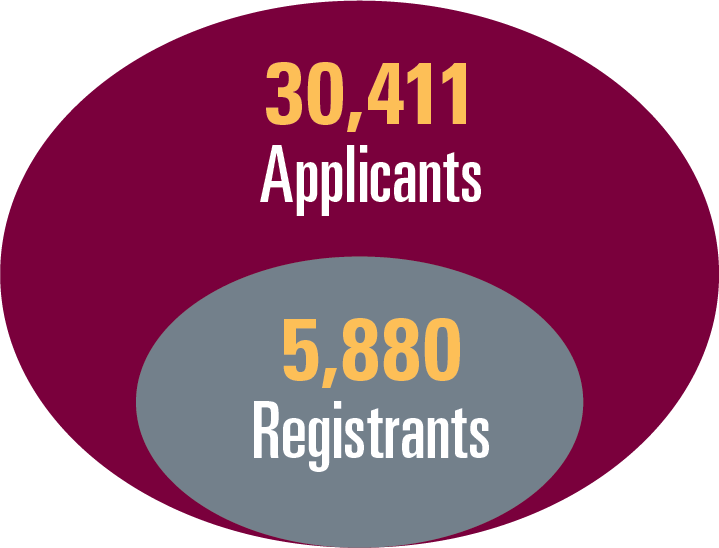
Undergraduate Admissions from Ontario High Schools
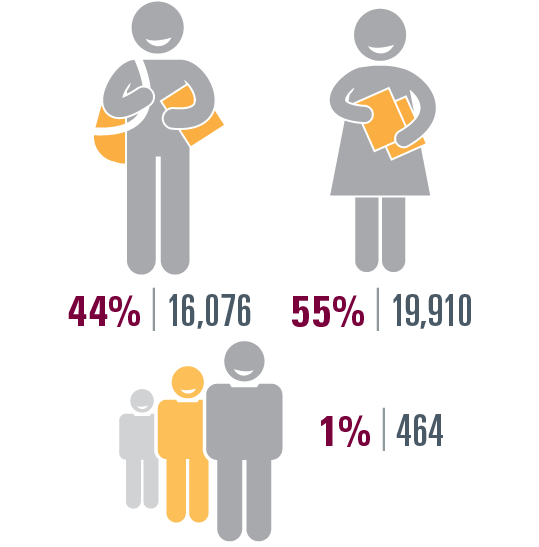
| Gender | Undergraduate | Graduate |
|---|---|---|
| Male | 13,908 | 2,168 |
| Female | 17,199 | 2,711 |
| Other | 426 | 38 |
| Gender | Full-Time | Part-Time | Domestic | International | Total |
|---|---|---|---|---|---|
| Undergraduate | 96% (30,171) |
4% (1,362) |
86% (26,973) |
14% (4,560) |
87% (31,533) |
| Graduate | 83% (4081) |
17% (836) |
76% (3,737) |
24% (1,180) |
13% (4,917) |

Undergraduate (%)
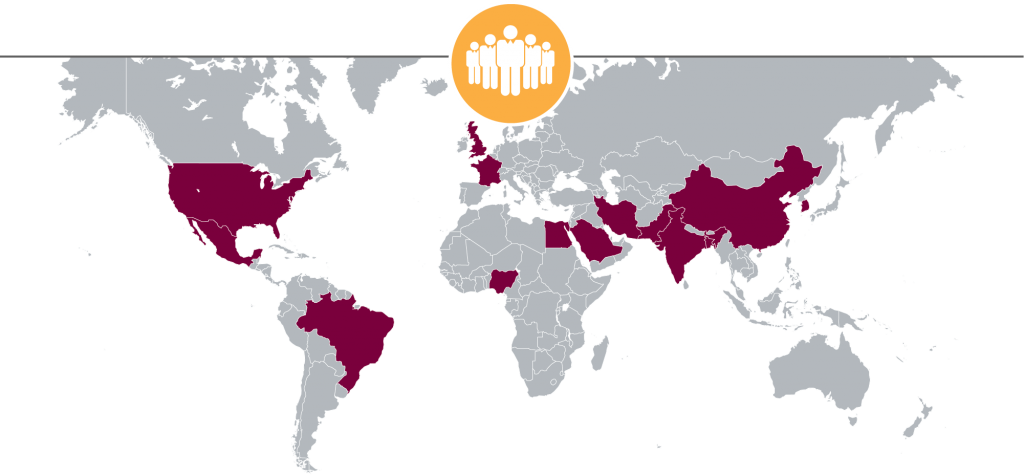
China 71.6 India 5.4 South Korea 2.5 Nigeria 2.1 Saudi Arabia 1.7 Hong Kong 1.4 Bangladesh 1.1 Pakistan 1.0 Kuwait 0.8 Viet Nam 0.8
Graduate (%)
China 34.5 India 19.1 Iran 14.4 Egypt 5.8 USA 3.2 Brazil 2.4 Bangladesh 2.0 Saudi Arabia 1.8 Mexico 1.4 South Korea 1.0
November 1, 2020 Student Headcount.
Undergraduate Total Headcount Enrolment by Faculty (Fall 2020)
| Faculty | Enrolment |
|---|---|
| Business | 3,741 |
| Engineering | 6,935 |
| Health Sciences | 5,090 |
| Humanities | 2,256 |
| Science | 8,444 |
| Social Sciences | 4,626 |
| Arts & Science | 283 |
| Divinity College | 158 |
Degrees Awarded CY 2020
| Degree | Male | Female | Other |
|---|---|---|---|
| Bachelor | 2,442 | 3,271 | 68 |
| First Professional | 115 | 110 | 0 |
| Masters | 675 | 883 | 14 |
| Doctoral | 144 | 102 | 0 |
| Graduate Cert/Dip | 12 | 25 | 0 |
| Total | 3,388 | 4,391 | 82 |
Information Box Group
Total Full-time Faculty by Rank

Lecturer
1%

Assistant Professor
27.1%

Associate Professor
29.8%

Full Professor
42.5%
Information Box Group
Total Full-time Faculty by Faculty
Business
8%
Engineering
17%
Health Sciences
32%
Humanities
11%
Social Sciences
12%
Science
20%
Information Box Group
205,810
Alumni
10
Vanier Scholars
1
Banting Fellow
3
Nobel Prize Winners
91%
Undergraduates continued to 2nd year
81%
Undergraduates graduated within 7 years
(2011 cohort)
15
3M National Teaching Fellowhip
18
World's Most Highly Cited Researchers
(Clarivate Analytics 2020)


